
SPX | Macro Market Transition: A Time-Price Research Study | November 13, 2026

An independent study of market structure, historical symmetry, and cyclical timing relationships.
Executive Research Overview
The broader equity market is demonstrating increasingly significant signs of a macro structural transition, as prolonged consolidation has begun resolving into sustained bearish expansion. Following an extended period of bullish market development, the convergence of historical price symmetry, geometric structure, Fibonacci relationships, and cyclical timing suggests that SPX and NDQ may be entering a more substantial corrective phase.
Recent market behavior has reinforced this developing outlook. The breakdown of critical macro support, increasing directional volatility, and deterioration in broader price structure have introduced conditions consistent with the early stages of a potentially prolonged bearish market environment.
The central thesis of this research is that the current market structure may represent more than an intermediate correction, with the potential for a broader macro bear market developing through the convergence of multiple independent analytical relationships.
This report examines the market through four primary research disciplines: macro market geometry, Fibonacci price and time analysis, historical market symmetry, and planetary cycle research. Each methodology provides a distinct perspective on the potential magnitude, duration, and transitional characteristics of the developing market environment.
Particular attention is given to historical relationships between major market peaks, recurring timing rhythms, and astronomical cycles. These relationships are evaluated alongside observable price structure to identify potential areas of price-time convergence.
The objective is not to establish a predetermined market outcome, but to present a comprehensive forward-looking framework for evaluating the developing bearish thesis, identifying potential downside objectives, and monitoring the structural and cyclical conditions that may precede significant market transitions.
While the prevailing research framework currently supports an elevated-risk bearish outlook, confirmation through subsequent market behavior remains essential. Alternative scenarios and conditions that would invalidate the broader thesis are considered throughout the analysis.
Macro Market Geometry
Long-Term Bullish Expansion Structure
The March 23, 2020 pivotal low, established during the COVID-19 market collapse, serves as a significant geometric anchor within the broader equity market structure. This low established the foundation for a long-term bullish expansion channel, with its central median line providing a recurring structural reference throughout the subsequent market advance.
Over the past several years, SPX has demonstrated notable respect for this geometric framework, with price behavior repeatedly responding to the channel's projected boundaries and median-line relationships.
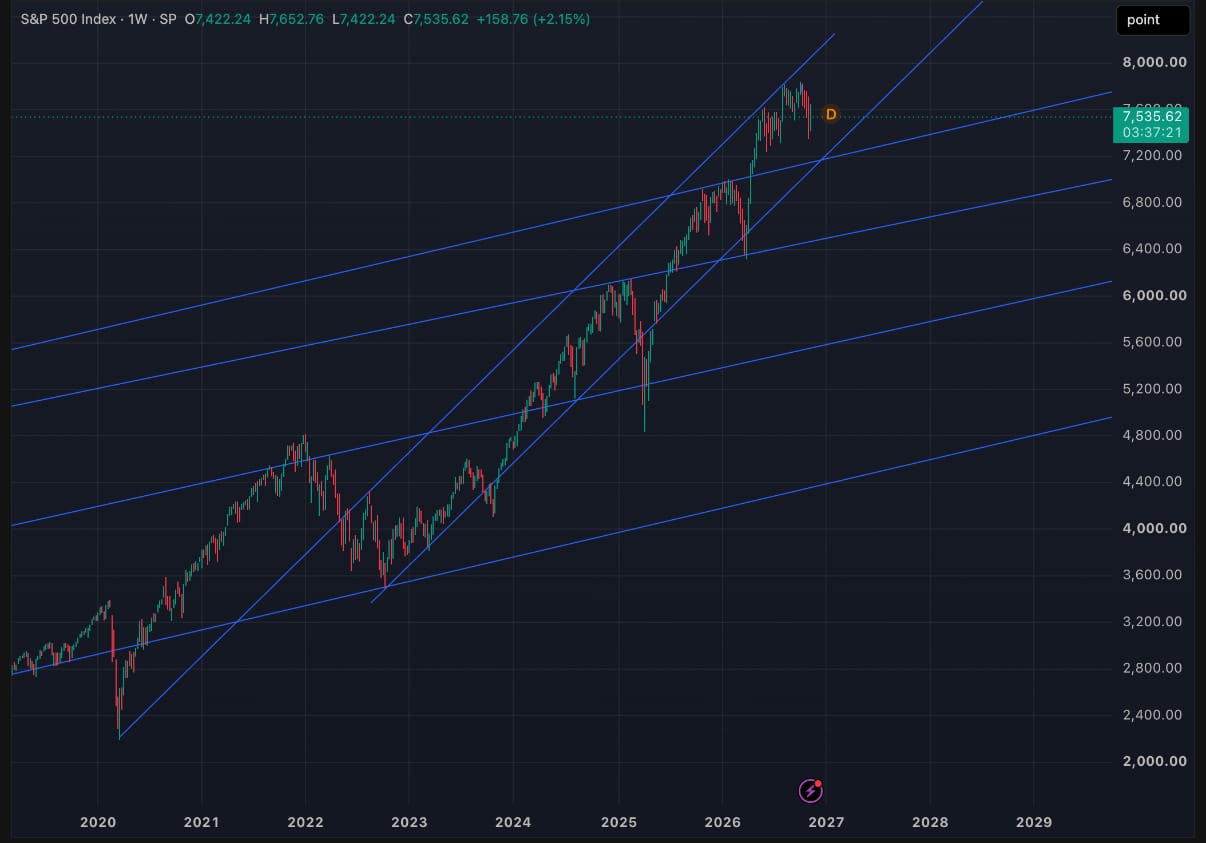
Of particular significance, the primary median line was tested in August 2026 for the first time since August 2022, marking an important structural development within the broader bullish trend.
Since this interaction, price behavior has demonstrated increasing instability, raising questions regarding the sustainability of the long-term expansion structure.
A decisive breakdown below the channel's lower parallel boundary would represent a significant deterioration in macro market geometry, strengthening the case for a more substantial bearish transition. Such a development would suggest that the long-standing bullish framework is no longer providing the same structural support that characterized previous market advances.
Historical Geometric Resistance | 2000–2026
An additional geometric relationship emerges from the major market peak established in 2000, which provides a long-term historical reference for projecting resistance into the current market environment.
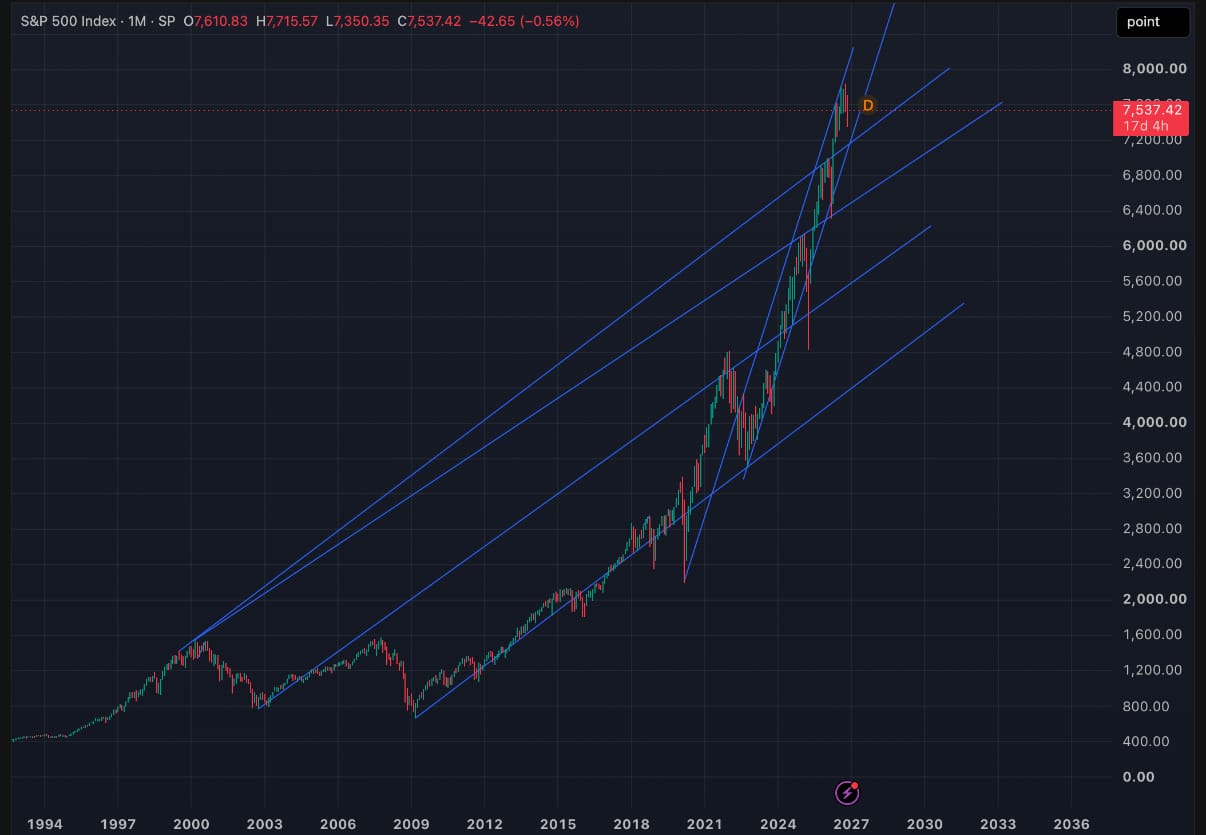
This historical resistance projection converges around December 2026 with the lower parallel boundary of the bullish expansion structure established from the October 13, 2022 bear market pivot low.
The convergence of these two geometric relationships introduces a potentially significant structural intersection, where resistance projected from a historical market peak aligns with a major boundary of the more recent bullish expansion framework.
A test of this region toward the end of 2026 remains an important scenario under consideration.
Should price approach this geometric intersection, the subsequent reaction will provide valuable insight into the broader market structure. A decisive rejection would reinforce the developing bearish thesis, particularly if accompanied by renewed downside momentum and increasing volatility.
Conversely, sustained acceptance above the converging resistance structures would weaken the immediate bearish interpretation and warrant reassessment of the broader macro outlook.
Geometric Implications & Forward Outlook
The relationship between the March 2020 expansion channel, the October 2022 bullish structure, and historical resistance projected from the 2000 market peak establishes an important geometric framework for evaluating the developing macro market transition.
The primary structural considerations remain the integrity of the long-term bullish channel and the potential convergence of major geometric resistance toward December 2026.
A confirmed breakdown of the lower parallel support would provide substantial additional evidence of bearish structural deterioration, while the market's response to the projected year-end resistance intersection could offer further insight into the sustainability of the broader trend.
As these relationships develop, the convergence of historical geometry, price behavior, and cyclical timing will remain central to assessing whether the current market weakness represents an intermediate correction or the early stages of a more prolonged macro bear market.
Fibonacci Price Analysis & Historical Symmetry
Macro Fibonacci Convergence | SPX 7,840
From a macro perspective, SPX has demonstrated significant convergence across multiple historical price relationships, with geometric projections, Fibonacci extensions, and recurring symmetrical movements identifying a concentrated resistance region near 7,840.
This region represents a particularly important structural reference within the developing bearish thesis, as several long-term projections derived from separate historical market movements converge near the recent macro high.
Two major Fibonacci extension relationships are especially notable:
- 2022 Bear Market: The 3.272 Fibonacci extension projects resistance near SPX 7,840.
- 2025 Tariff-Driven Correction: The 2.272 Fibonacci extension similarly projects resistance near SPX 7,840.
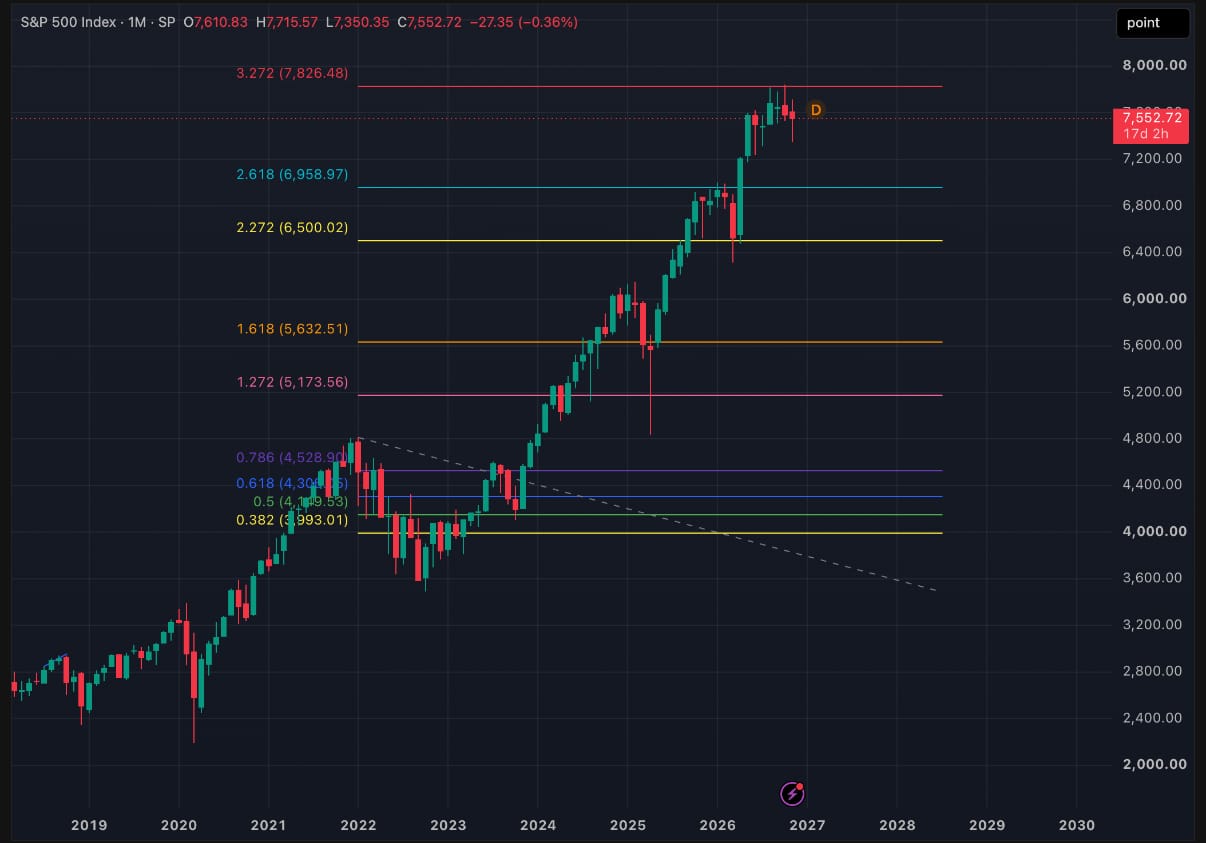
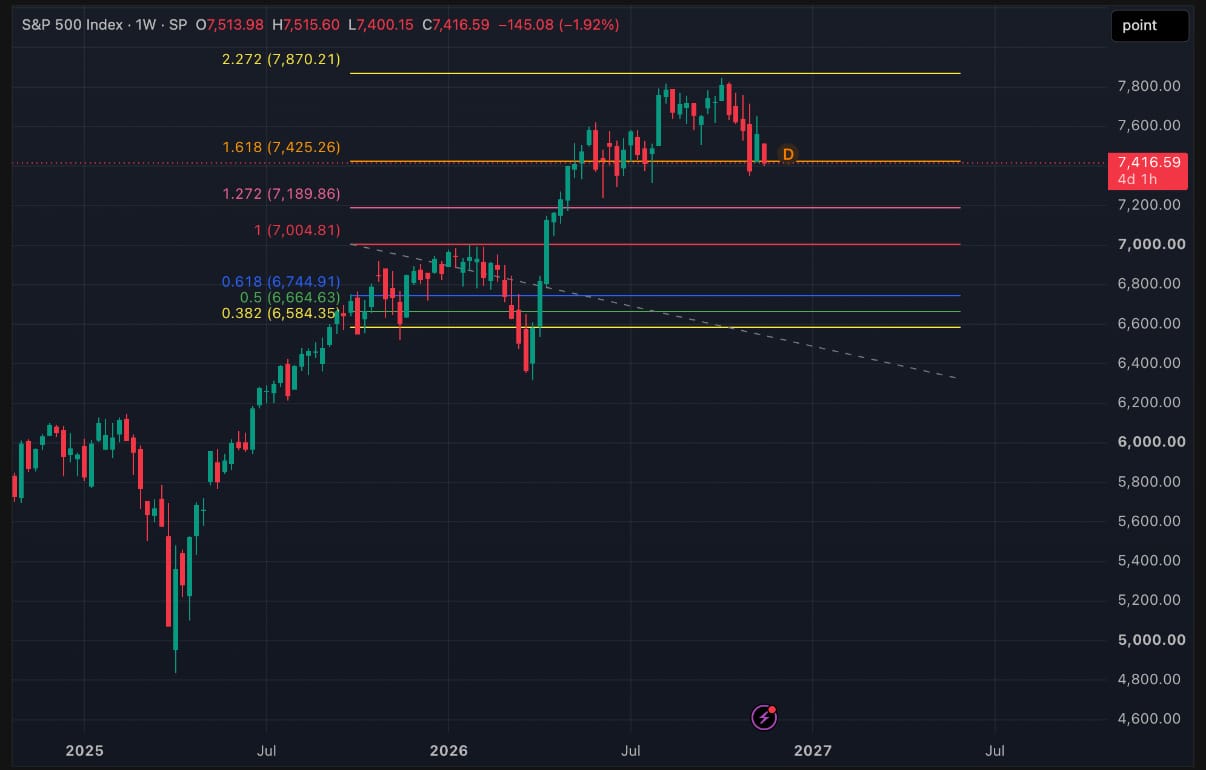
The convergence of these extension objectives establishes a significant macro resistance region, particularly given the subsequent bearish pressure observed following the market's interaction with these levels.
While individual Fibonacci projections do not independently establish the probability of a market reversal, the alignment of multiple historical price relationships strengthens the importance of this region within the broader structural framework.
Historical Price Symmetry | Two-Drive Expansion
Beyond Fibonacci extensions, the historical progression of SPX reveals notable symmetry between major bullish expansion phases.
From the March 2009 bear market low to the 2022 market peak, SPX advanced approximately 4,150 points.
Projecting an equivalent 4,150-point expansion from the 2022 bear market low produces an upside objective that closely converges with the previously identified Fibonacci resistance region near 7,840.
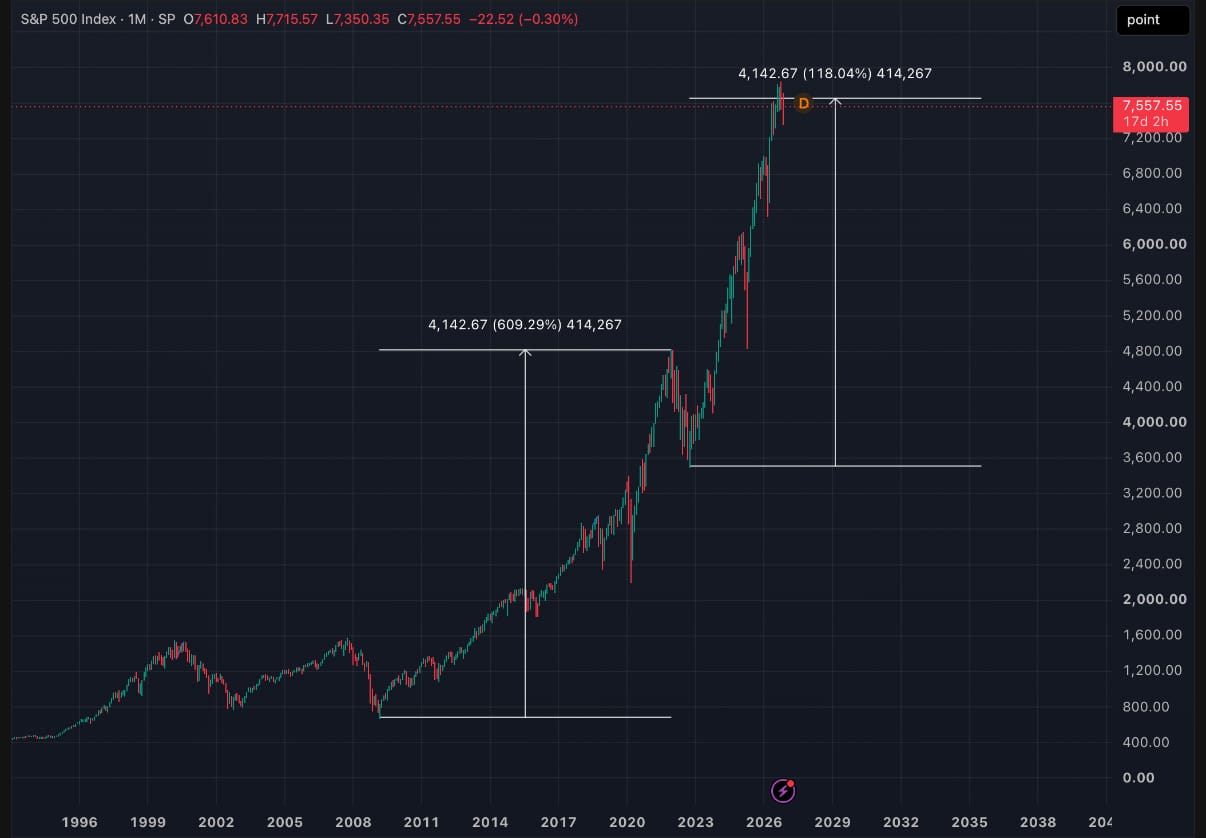
This relationship establishes a symmetrical two-drive expansion pattern, in which two major bullish advances of comparable magnitude terminate near a common projected resistance objective.
The significance of this relationship lies in the alignment between historical price displacement and independently measured Fibonacci extension levels.
The recent bearish reaction near this projected region introduces the possibility that the second major expansion phase has reached an important point of structural exhaustion.
Historical Price Symmetry | Three-Drive Expansion
An additional historical relationship emerges when examining the bullish expansion originating from the March 2020 market low.
Between the 2020 bear market bottom and the 2022 market peak, SPX advanced approximately 2,620 points.
When this expansion move is mirrored from the October 2022 bear market low, the resulting projection aligns closely with the major market peak established before the 2025 tariff-driven correction.
Extending the same approximately 2,620-point movement from the pivot 2025 corrective low produces another resistance objective near the current macro market highs.
This sequence establishes a recurring three-drive price symmetry relationship, with comparable bullish expansions developing across separate market phases.
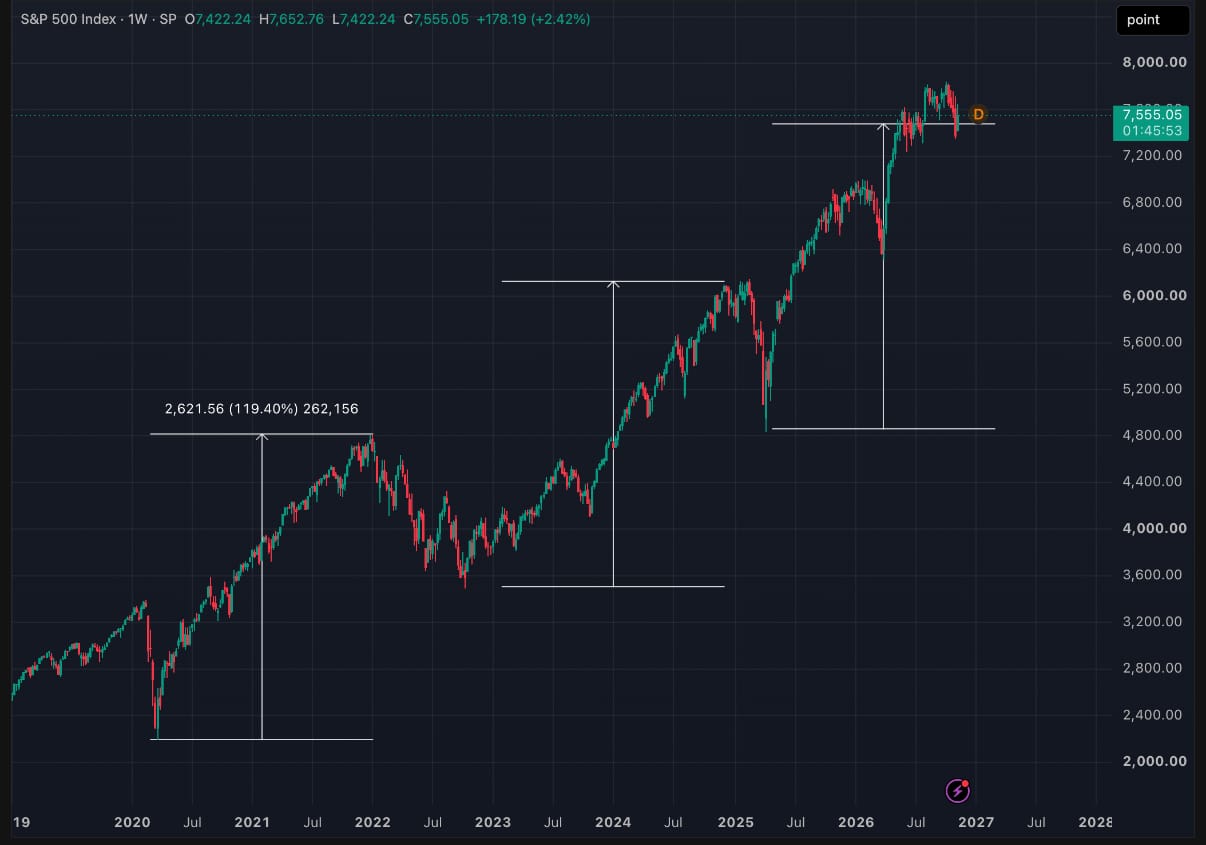
The repeated appearance of similar price displacement is particularly noteworthy because the third projected expansion converges with the broader Fibonacci resistance cluster near 7,840.
Together, these relationships suggest that the recent macro high represents more than an isolated technical resistance level. It marks a concentrated intersection of historical price projections spanning multiple market cycles.
Macro Implications & Structural Outlook
The convergence of Fibonacci extensions and recurring historical price symmetry near SPX 7,840 establishes an important foundation for the broader bearish market thesis.
The primary relationships include the 3.272 extension of the 2022 bear market, the 2.272 extension of the 2025 tariff-driven correction, the approximately 4,150-point symmetrical two-drive expansion, and the recurring 2,620-point three-drive structure.
The concentration of these projections within a relatively narrow price region, followed by the recent deterioration in market structure, warrants heightened caution regarding the sustainability of the long-term bullish trend.
The significance of this convergence is further reinforced when evaluated alongside the macro geometric relationships and developing volatility structure discussed elsewhere in this report.
While historical symmetry does not guarantee that a major market peak has been established, the recent rejection from this region provides an important structural reference for evaluating the potential transition toward a prolonged bearish environment.
A sustained recovery above the macro resistance cluster would weaken the interpretation of structural exhaustion, while continued bearish expansion below established support would strengthen the case that the recent high represents a significant macro turning point.
Moving forward, the relationship between these historical price projections, subsequent market behavior, and developing cyclical timing will remain central to assessing the magnitude and duration of the potential bearish transition.
Macro Timing & Planetary Cycle Analysis
The 18.6-Year Lunar Nodal Cycle
Long-duration astronomical cycles have been examined by financial and economic cycle researchers as potential reference points for identifying recurring transitions in market behavior, volatility, and broader economic conditions.
Among these relationships is the approximately 18.6-year lunar nodal cycle, representing the period required for the Moon's orbital nodes to complete a full revolution through the zodiac.
Within this research framework, particular attention is given to the True North Node and its movement through successive 30-degree segments of the complete 360-degree cycle. These transitions establish a recurring astronomical timing structure through which historical market behavior can be examined across multiple decades.
Rather than evaluating the complete 18.6-year period as a single market cycle, this analysis focuses on individual zodiacal transitions, with particular emphasis on the True North Node's passage through Aquarius.
Historical observations suggest a recurring association between these Aquarius passages and periods of heightened equity-market instability, significant corrections, and major structural turning points.
The objective is to evaluate whether these relationships provide meaningful supplementary context when considered alongside macro market geometry, Fibonacci price projections, and historical price symmetry.
True North Node in Aquarius | Historical Market Behavior
A preliminary historical study covering the period from 1900 through 2026 examines six completed passages of the True North Node through Aquarius, with the current 2026–2028 passage representing the seventh observation.
The historical review identifies a recurring association between Aquarius nodal periods and substantial corrective movements across the broader equity market.
Of the six completed passages, five are associated with identified equity-market decline episodes of approximately 15% or greater, representing approximately 83.3% of the historical sample.
Further examination reveals that four of the six historical passages are associated with declines of approximately 20% or greater, including three particularly significant corrective environments.
Importantly, the historical timing of significant market peaks has varied considerably between occurrences.
Some major peaks developed during the Aquarius passage, followed by sustained bearish pressure. Other periods, particularly the 2007–2009 financial crisis, experienced significant market deterioration following a peak established just before the nodal transition.
This distinction suggests that the historical relationship is better evaluated as a potential period of elevated macro market risk rather than a precise market-top indicator.
The historical record also includes a notable bullish counterexample during the 1914–1916 passage, when a significant market bottom developed approximately at the beginning of the cycle, reinforcing the importance of evaluating the broader market environment rather than assuming a predetermined bearish outcome.
Historical Statistical Research | 1900–2026
The preliminary study evaluates selected historical S&P composite/S&P 500 price-series correction episodes associated with completed Aquarius nodal passages.
Across the six completed historical occurrences, the following relationships were identified:
| Historical observation | Occurrences | Frequency |
|---|---|---|
| Passage associated with a decline of approximately 15% or greater | 5 of 6 | 83.3% |
| Passage associated with a decline of approximately 20% or greater | 4 of 6 | 66.7% |
| Passage associated with a decline of approximately 30% or greater | 3 of 6 | 50.0% |
| Significant market bottom near the beginning of the passage | 1 of 6 | 16.7% |
Among the five identified corrective episodes, the average full-event peak-to-trough decline measured approximately 35.0%, with a median decline of 33.0%.
These statistics describe selected historical market events associated with the Aquarius passages. They do not represent drawdowns occurring exclusively within the transit, nor do they establish the probability of a future correction.
Historical Passage Review
1914–1916 | Significant Market Bottom
The earliest completed passage in the study began in December 1914 and continued through May 1916.
Unlike the predominantly bearish historical observations identified in later periods, this occurrence coincided approximately with a significant market bottom near the beginning of the Aquarius cycle.
The subsequent market environment demonstrated bullish expansion, establishing an important historical counterexample to the predominantly bearish relationships observed in later passages.
The historical benchmark data for this occurrence remains subject to final verification.
1933–1935 | Significant Corrective Environment
During the 1933–1935 cycle, the market established a significant peak on July 17, 1933, followed by a substantial corrective movement.
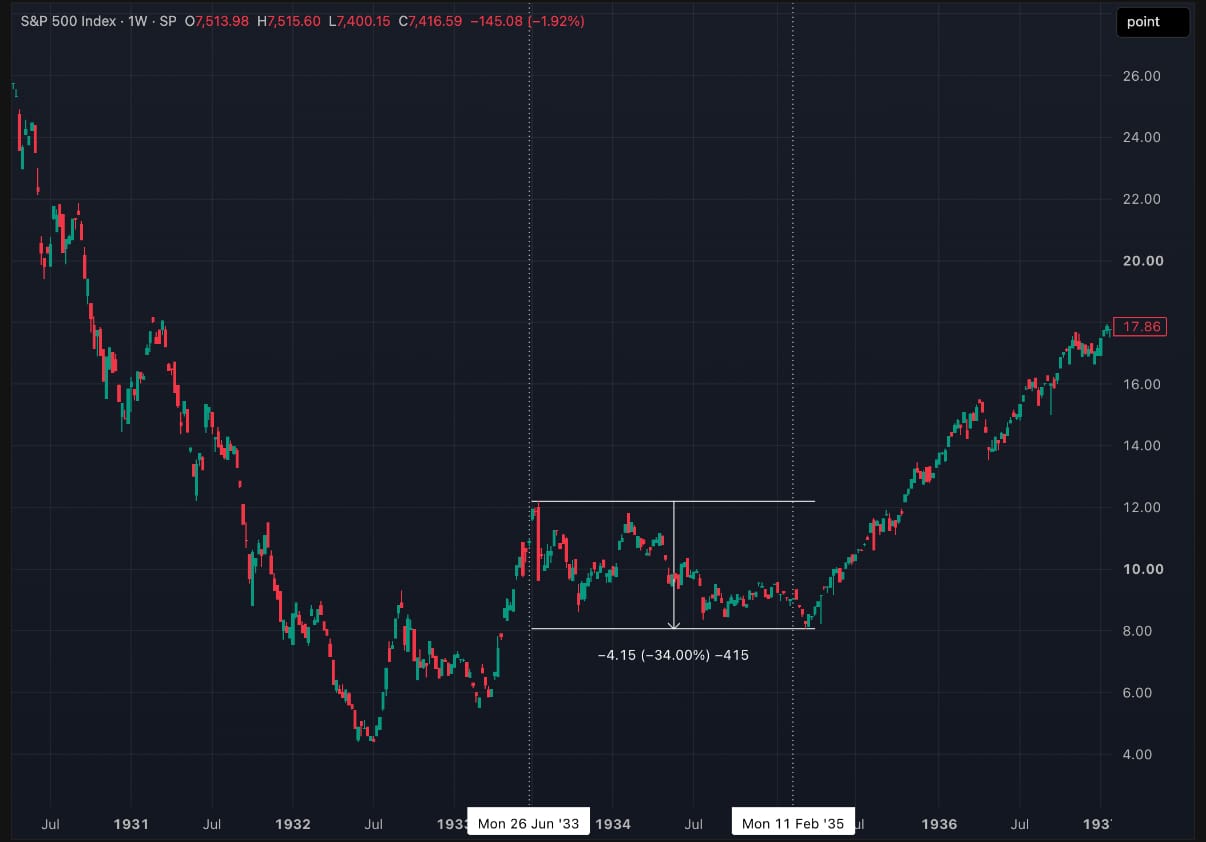
The identified peak-to-trough decline reached approximately 33%, with the selected market trough occurring on March 14, 1935, shortly after the Aquarius passage concluded.
This occurrence demonstrates a significant market peak developing within the nodal period, followed by bearish pressure extending beyond the astronomical transition.
1952–1953 | Intermediate Market Correction
The 1952–1953 passage coincided with a market peak on January 5, 1953, followed by a corrective decline of approximately 14.9% into September 14, 1953.
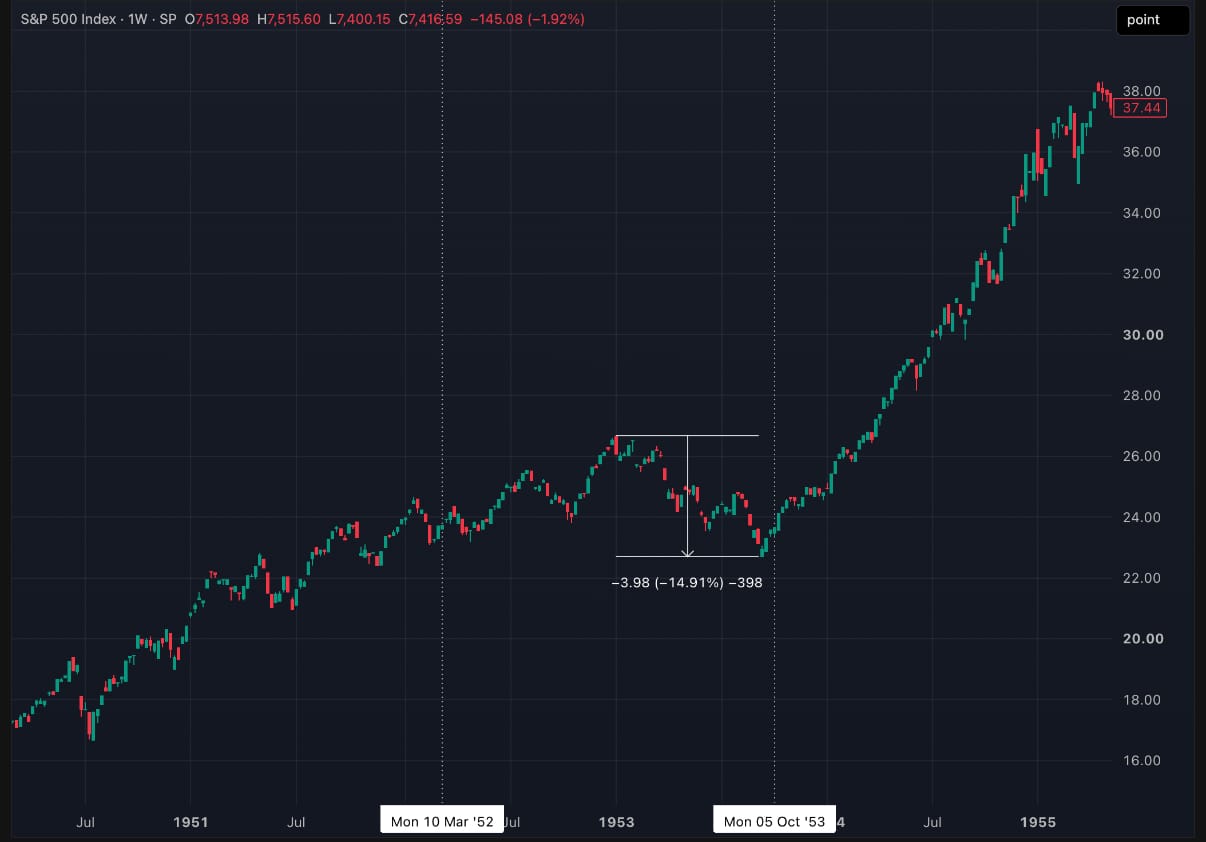
Both the selected peak and trough occurred within the Aquarius period, establishing a historical example of a complete corrective movement developing during the transit.
1970–1972 | Major Bear Market Relationship
The 1970–1972 Aquarius passage preceded the significant 1973–1974 bear market, during which the broader equity market experienced a peak-to-trough decline of approximately 50%.
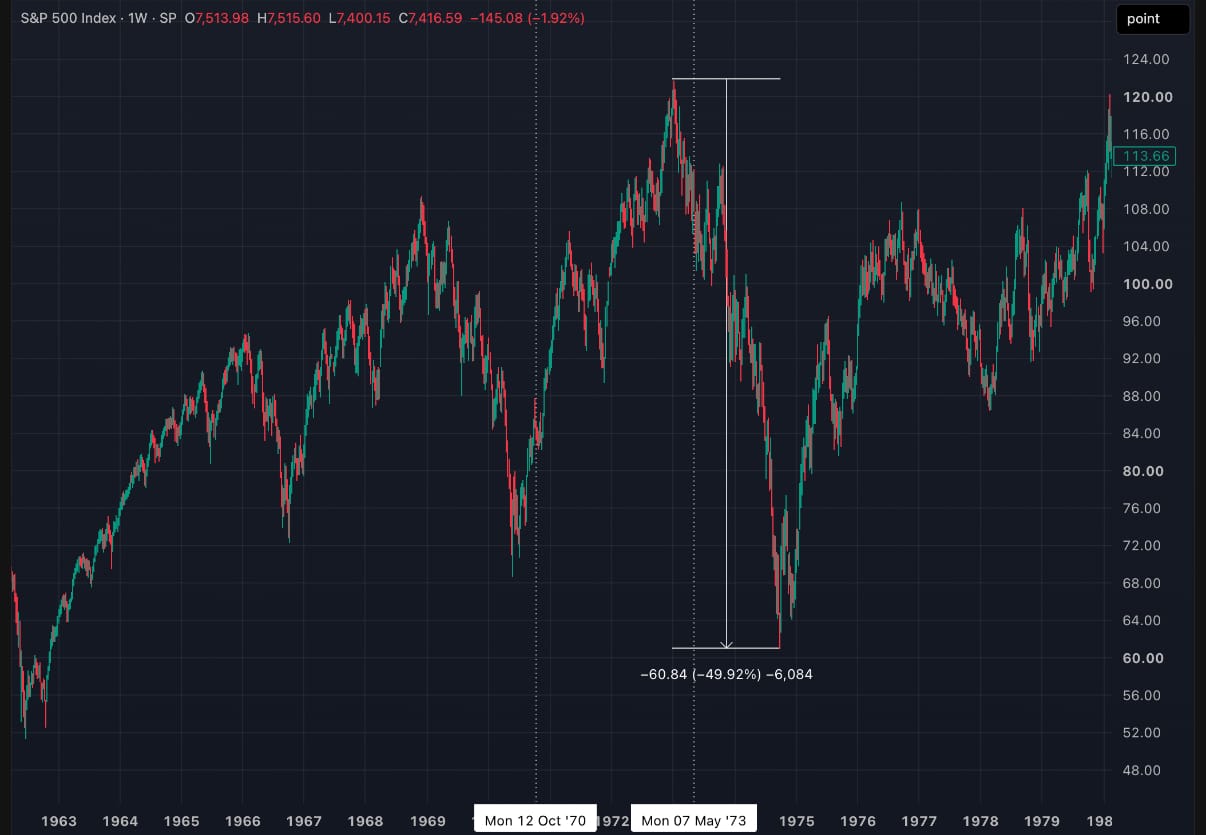
This major bearish environment developed following the completion of the Aquarius transit, rather than entirely within the passage itself.
The relationship is therefore considered a broader post-cycle historical observation, demonstrating the potential for significant market deterioration following a nodal transition.
Because the decline began after the Aquarius passage concluded, it is distinguished from corrections occurring directly within the transit.
1989–1990 | Bearish Volatility Expansion
The 1989–1990 passage coincided with a significant market peak on July 16, 1990, followed by a decline of approximately 20% into October 11, 1990.
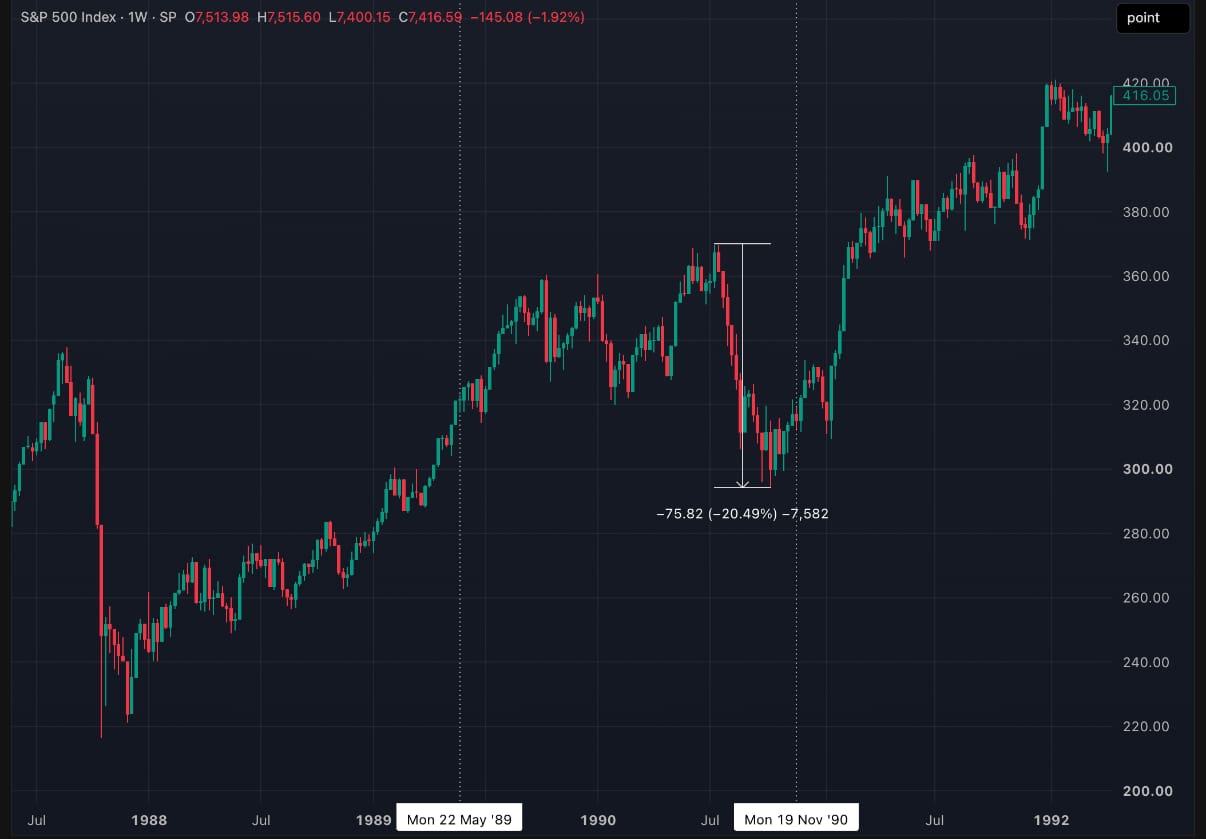
This occurrence represents another historical example of a market peak and subsequent corrective expansion developing within the Aquarius transit.
2007–2009 | Global Financial Crisis
The 2007–2009 passage overlapped one of the most significant bearish market environments in modern financial history.
The market established its major peak on October 9, 2007, before the True North Node transitioned into Aquarius during December 2007.
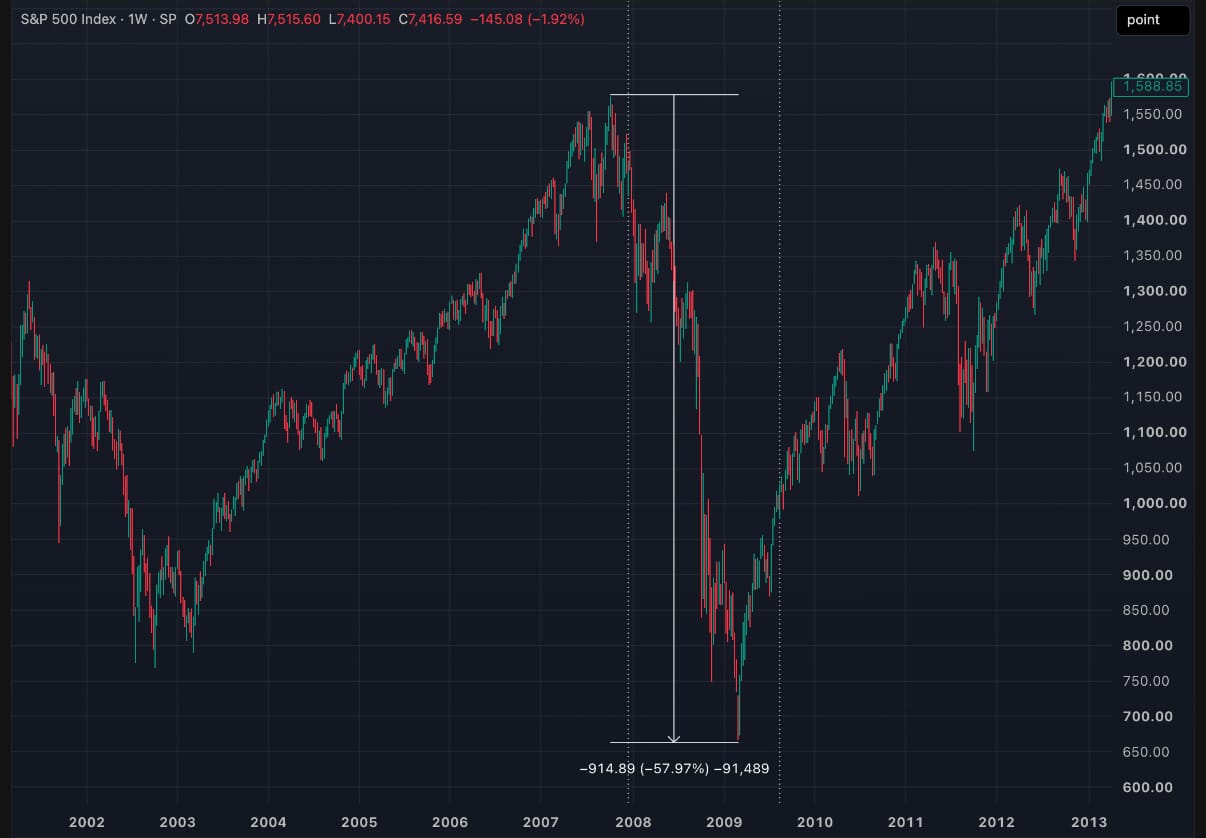
The subsequent decline extended through the Aquarius passage, culminating in the March 9, 2009 market bottom.
The full peak-to-trough decline measured approximately 57%.
This occurrence is particularly significant because it demonstrates that a major market peak need not form within the Aquarius period for substantial bearish pressure to develop during the transit.
However, because the market peak preceded nodal entry, this event is classified as an overlapping bear-market episode rather than an Aquarius-period peak.
Current Macro Cycle | July 2026 – March 2028
The current True North Node passage through Aquarius began approximately July 27, 2026, with the next zodiacal transition projected for March 26, 2028.
This establishes a long-duration astronomical timing period that is particularly relevant within the developing macro bearish market thesis.
The transition into Aquarius has occurred during a period in which SPX and NDQ have approached major historical Fibonacci extension objectives, recurring symmetrical price projections, and significant long-term geometric boundaries.
Of particular significance, SPX has demonstrated a concentration of historical price projections near the 7,840 region, including the 3.272 Fibonacci extension of the 2022 bear market and the 2.272 extension of the 2025 tariff-driven correction.
Additional historical price symmetry relationships, including recurring bullish expansions of approximately 4,150 and 2,620 points, further reinforce the significance of the broader macro resistance region.
The convergence of these price relationships with the transition into a new lunar nodal phase introduces an important intersection between long-term market structure and cyclical timing.
While historical Aquarius passages have frequently been associated with significant corrective environments within the preliminary sample, the timing of market peaks and bearish expansion has varied considerably.
Consequently, the current nodal transit is not interpreted as identifying a specific market peak or guaranteed period of sustained decline.
Rather, it establishes a broader macro timing framework within which subsequent market behavior can be evaluated for evidence of structural deterioration, volatility expansion, and potential bearish continuation.
Historical Time Symmetry | The 2,755-Day Macro Cycle
In addition to the long-duration astronomical timing relationships, SPX has demonstrated a notable recurring historical time symmetry extending back to the 2000 market peak.
Over the past several decades, an approximately 2,755-day macro timing rhythm has closely aligned with several significant structural turning points, encompassing both major market peaks and bear market bottoms.
The initial reference period originates from the 2000 and 2007 market peaks, which were separated by approximately 2,755 calendar days. Projecting this temporal displacement forward reveals recurring alignment with subsequent macro market pivots.
- 2000: Initial macro market peak and cyclical anchor point.
- 2007: Major market peak preceding the global financial crisis.
- 2015: Macro market peak preceding corrective pressure throughout 2015 and early 2016.
- 2022: Projected cycle transition occurring within weeks of the October 2022 bear market bottom.
2030: Next projected full-cycle transition, occurring approximately in June 2030.
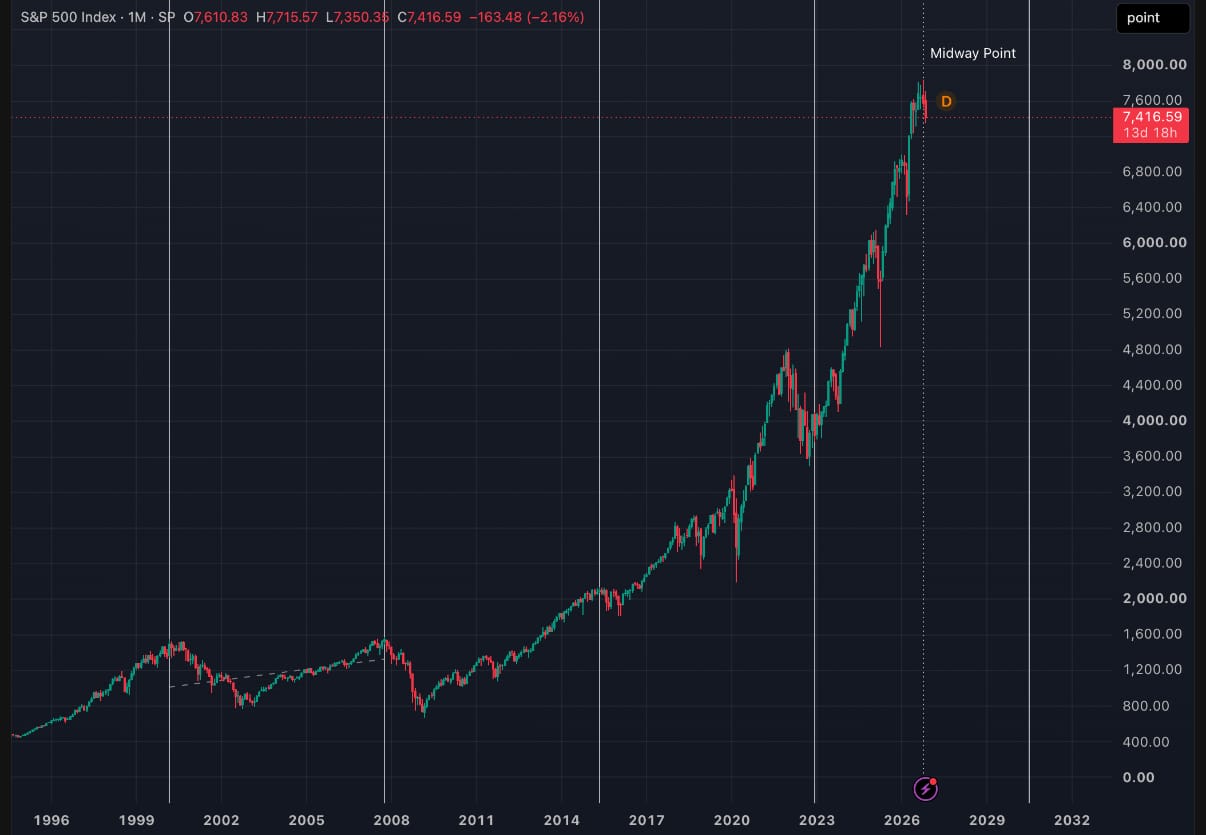
The recurring alignment of this temporal relationship with significant market pivots suggests that the cycle is worth monitoring as a potential framework for identifying macro structural transitions, rather than as a predetermined directional indicator.
Fibonacci Time Convergence | 2026 Macro Peak
While the next complete transition of the 2,755-day cycle is not projected to occur until June 2030, an additional timing relationship emerges through the application of Fibonacci ratios to the current cyclical interval.
Of particular significance, the 0.500 Fibonacci time relationship, representing the approximate midpoint of the current macro cycle, closely converges with the recent SPX market peak near 7,840.
This temporal alignment is particularly noteworthy given the concentration of historical price relationships previously identified within the same region.
The convergence surrounding the current macro peak includes:
- The 3.272 Fibonacci price extension of the 2022 bear market.
- The 2.272 Fibonacci price extension of the 2025 tariff-driven correction.
- The approximately 4,150-point historical two-drive price symmetry.
- The approximately 2,620-point historical three-drive price symmetry.
- The 0.500 Fibonacci time relationship of the 2,755-day macro cycle.
- The recent transition of the True North Node into Aquarius.
- Significant long-term geometric resistance relationships.
The concentration of these relationships establishes a notable intersection between macro price and time structure.
While the historical timing rhythm has previously aligned with both market peaks and bottoms, the recent development of bearish pressure following the current price-time convergence provides additional context for interpreting the nature of this potential cyclical transition.
The significance of the current environment therefore extends beyond the individual Fibonacci price projections or astronomical timing relationships. It is the collective convergence of historical price displacement, recurring temporal symmetry, geometric structure, and observable market deterioration that warrants heightened attention.
Although these relationships do not independently confirm the establishment of a macro market peak, they reinforce the broader research thesis that SPX may be approaching a significant transition in its long-term market environment.
Cyclical Convergence & Macro Implications
The convergence of the 18.6-year lunar nodal framework, the 0.500 Fibonacci time relationship of the recurring 2,755-day macro cycle, historical price symmetry, and long-term geometric structure establishes a particularly noteworthy macro price-time environment.
With both price and time relationships converging near the recent market peak, subsequent bearish pressure warrants heightened caution regarding the sustainability of the long-term bullish trend.
While no individual analytical relationship establishes a predetermined market outcome, the collective convergence of these observations strengthens the case for a potential macro structural transition, pending further confirmation through price and volatility behavior.
The central research consideration is whether the current market environment represents a significant structural transition occurring within a historically observed period of elevated cyclical risk.
The convergence of these relationships warrants heightened caution regarding the sustainability of the long-term bullish trend, while emphasizing the necessity of subsequent market confirmation.
Research methodology note: This preliminary historical case study uses six completed True North Node Aquarius passages and selected historical S&P composite/S&P 500 price-series correction episodes. Full-event declines may include market movements occurring before nodal entry or after exit. The 1973–1974 bear market is classified as a post-passage event rather than a decline overlapping the 1970–1972 Aquarius transit. Historical nodal ingress and exit dates require final ephemeris reconciliation. The study is descriptive and does not establish causation, statistical significance, or independently validated predictive probabilities.
Macro Volatility Structure | VIX
Transition from Compression to Expansion
Following an extended period of predominantly compressed volatility conditions, the Volatility Index (VIX) has begun to demonstrate notable changes in its broader structural behavior.
The convergence of long-term geometric structure, recent volatility behavior, and macro cyclical timing suggests that the prevailing volatility environment may be transitioning from compression toward sustained upside expansion.
Throughout the broader research framework, the 21.50–23.80 resistance region has served as the primary structural benchmark for confirming a more significant expansion in volatility and heightened uncertainty across the equity market.
While temporary increases in volatility have occurred throughout the recent market environment, a decisive breakout above this resistance region would provide stronger confirmation of a developing expansionary phase in VIX.
Such a transition would be particularly significant when evaluated alongside the macro resistance relationships and potential structural deterioration previously identified across SPX and NDQ.
Long-Term Geometric Structure | 2008–2026
From a macro geometric perspective, a significant long-term resistance projection originates from the historic volatility peak established in October 2008 during the global financial crisis.
Notably, this volatility peak also developed during the previous passage of the True North Node through Aquarius, as examined in the macro timing and planetary cycle analysis.
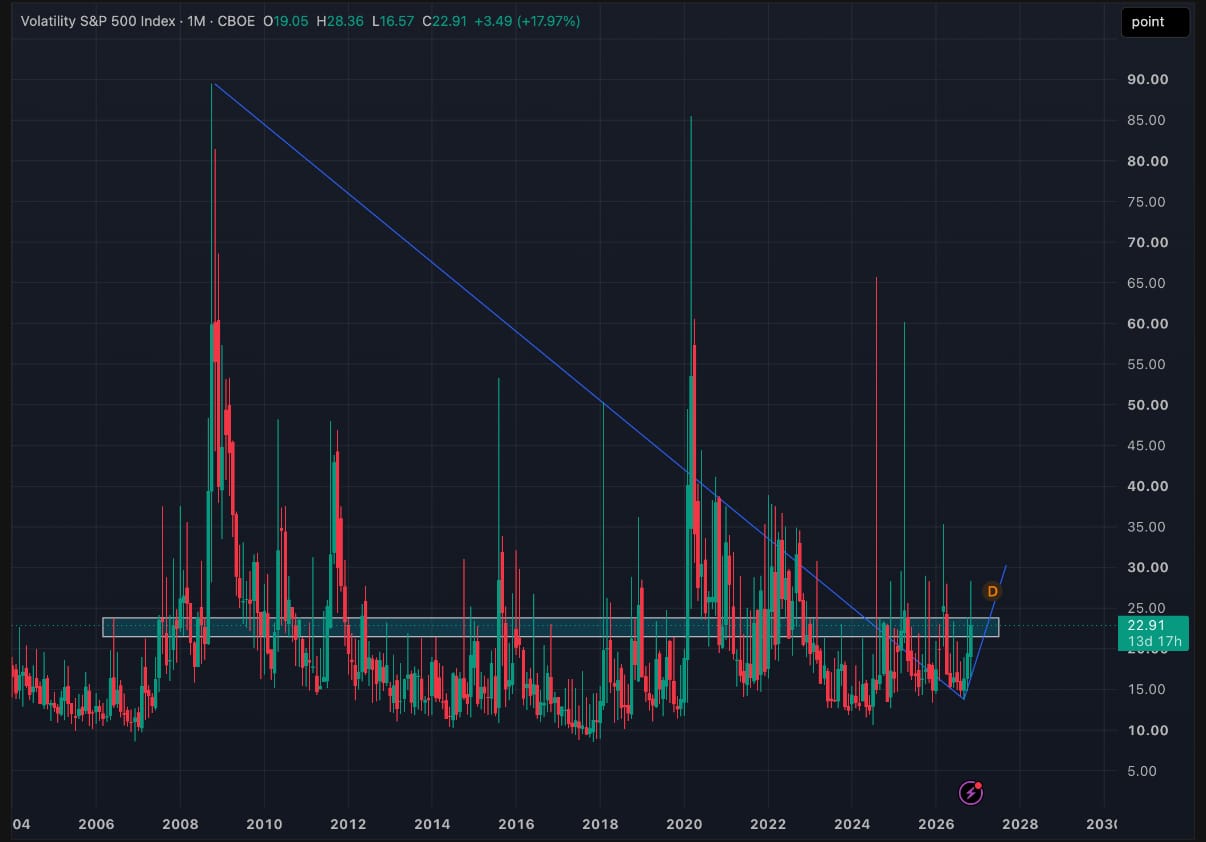
The geometric resistance projected from this historical anchor has provided a long-term structural reference for evaluating volatility behavior. Recent price action has demonstrated a breakout above this resistance structure, introducing a potentially significant change in the broader volatility environment.
Further supporting this structural development, VIX has established a recurring sequence of higher lows since September 2026, suggesting that underlying volatility conditions have become increasingly constructive for upside expansion.
The combination of a long-term geometric breakout and a developing higher-low structure represents a notable change in character within the broader volatility environment.
While this development does not independently confirm the emergence of a prolonged bear market, it provides additional structural evidence supporting the elevated-risk conditions identified throughout this report.
Volatility Behavior & Directional Confirmation
The November 5 volatility expansion provided a notable example of the developing change in market character, as VIX demonstrated significant upside momentum alongside substantial bearish pressure across the major equity indices.
Although this expansion was followed by a considerable contraction in volatility, the subsequent decline in VIX ultimately resolved in the formation of another higher low, preserving the developing bullish volatility structure.
This behavior is particularly significant when distinguishing temporary volatility spikes from a potentially more sustained expansionary environment.
Rather than fully retracing the preceding expansion and returning to its previous structural lows, VIX has continued to establish progressively higher support points.
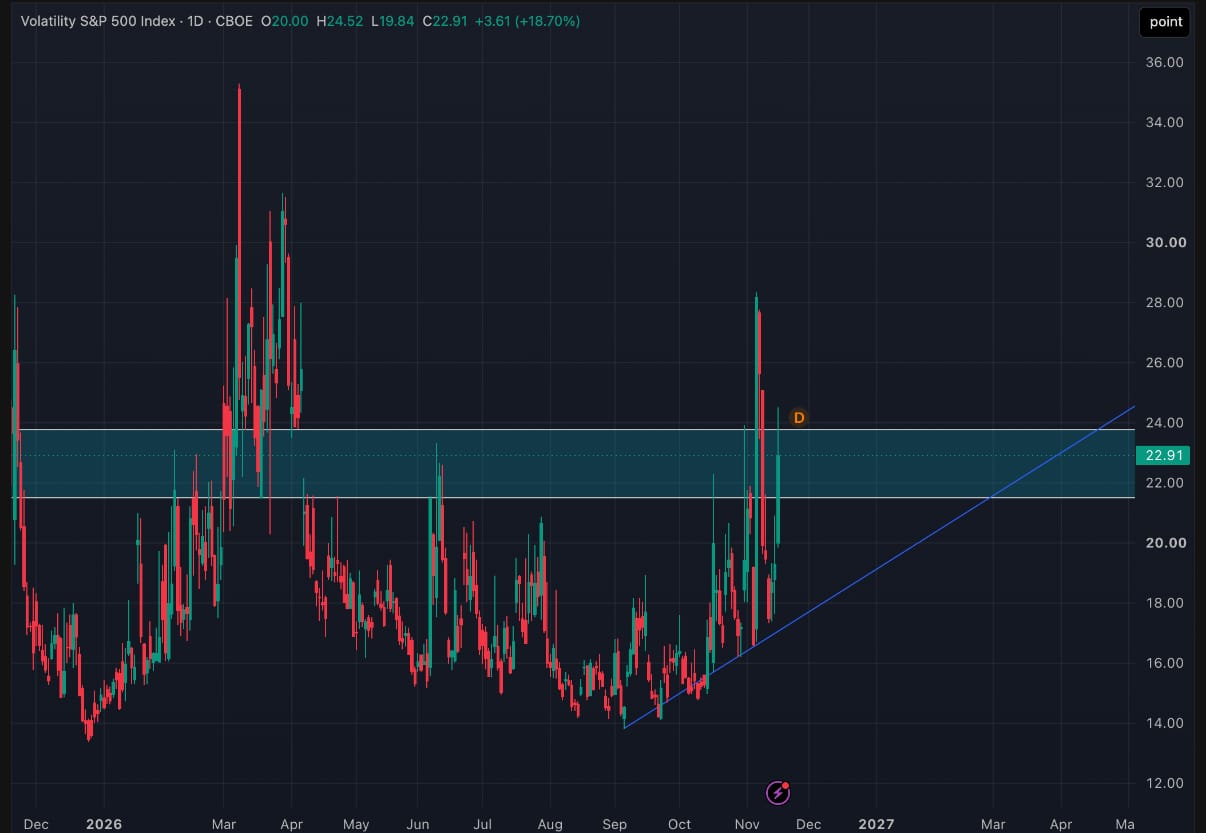
The 21.50–23.80 resistance region remains the primary benchmark for further directional confirmation. A decisive breakout and sustained acceptance above this region would strengthen the case for continued bullish expansion in VIX, with the potential for increasingly pronounced volatility movements and the establishment of higher highs.
Conversely, prolonged rejection from this resistance region, accompanied by a breakdown of the prevailing higher-low structure, would weaken the immediate volatility expansion thesis.
Volatility Convergence & Macro Market Implications
The developing structural changes in VIX introduce an additional layer of confluence within the broader macro bearish market thesis.
The primary volatility considerations include:
- A prolonged period of volatility compression.
- A breakout above long-term geometric resistance originating from the October 2008 volatility peak.
- A developing sequence of higher lows since September 2026.
- Preservation of bullish volatility structure following the November 5 expansion and subsequent contraction.
- The potential for sustained expansion above the 21.50–23.80 macro resistance region.
- Convergence with significant historical and astronomical timing relationships.
When evaluated alongside the macro geometric structures, Fibonacci extension objectives, historical price symmetry, and recurring timing relationships identified throughout this report, the developing volatility environment provides further evidence of a potential macro market transition.
The significance of these developments lies not solely in the recent increase in volatility, but in the underlying structural changes that may support a more prolonged expansionary phase.
A confirmed transition from volatility compression into sustained bullish expansion would materially strengthen the broader bearish market thesis, particularly if accompanied by a decisive breakdown of long-term geometric support across SPX and NDQ.
Until such confirmation develops, the convergence of these relationships warrants heightened caution regarding the sustainability of the long-term bullish equity market environment.
Moving forward, the relationship between volatility expansion, macro support deterioration, and historical cyclical timing will remain central to evaluating the magnitude and sustainability of the potential bearish transition.
Volatility Timing & Mapping | Mercury Retrograde Cycle
Cyclical Framework for Compression & Expansion
Throughout the research framework developed by Symmetry Timing Research, the Mercury retrograde cycle has served as an important temporal reference for mapping volatility and identifying potential transitions between compressed and expansionary market environments.
Occurring approximately three times per year, this astronomical cycle provides a recurring timing structure through which changes in market behavior, directional momentum, and volatility can be historically evaluated.
Rather than utilizing the cycle as a standalone directional indicator, the primary objective of this research is to identify periods during which prevailing market conditions may undergo significant structural or behavioral transitions.
Historical research spanning approximately 26 years has revealed recurring tendencies in market behavior during both the initial and post-cycle phases.
Historical Statistical Research | 2000–2026
Across approximately 84 historical cycle occurrences, research conducted by Symmetry Timing Research has identified the following behavioral tendencies:
| Historical Cycle Behavior | Observed Frequency |
|---|---|
| Initial-cycle compression | ~62% |
| Post-cycle directional expansion | ~78% |
These observations suggest a recurring tendency for markets to experience controlled or compressed price behavior during the initial cycle, followed by a greater prevalence of directional expansion during the subsequent period.
An additional component of this research involves the application of Fibonacci time ratios to the duration of each individual cycle. These ratios establish proportional timing relationships that have historically aligned with significant market pivots, volatility expansion, and changes in directional behavior.
Although these relationships do not guarantee a predetermined market outcome, their historical recurrence provides a foundation for investigating a potential statistical advantage in volatility and market-transition analysis.
Historical Cycle Observations | 2025–2026
March 14 – April 7, 2025 | Tariff-Driven Market Correction
The March 2025 Mercury retrograde cycle demonstrated a significant relationship with one of the most prominent volatility events of the year.
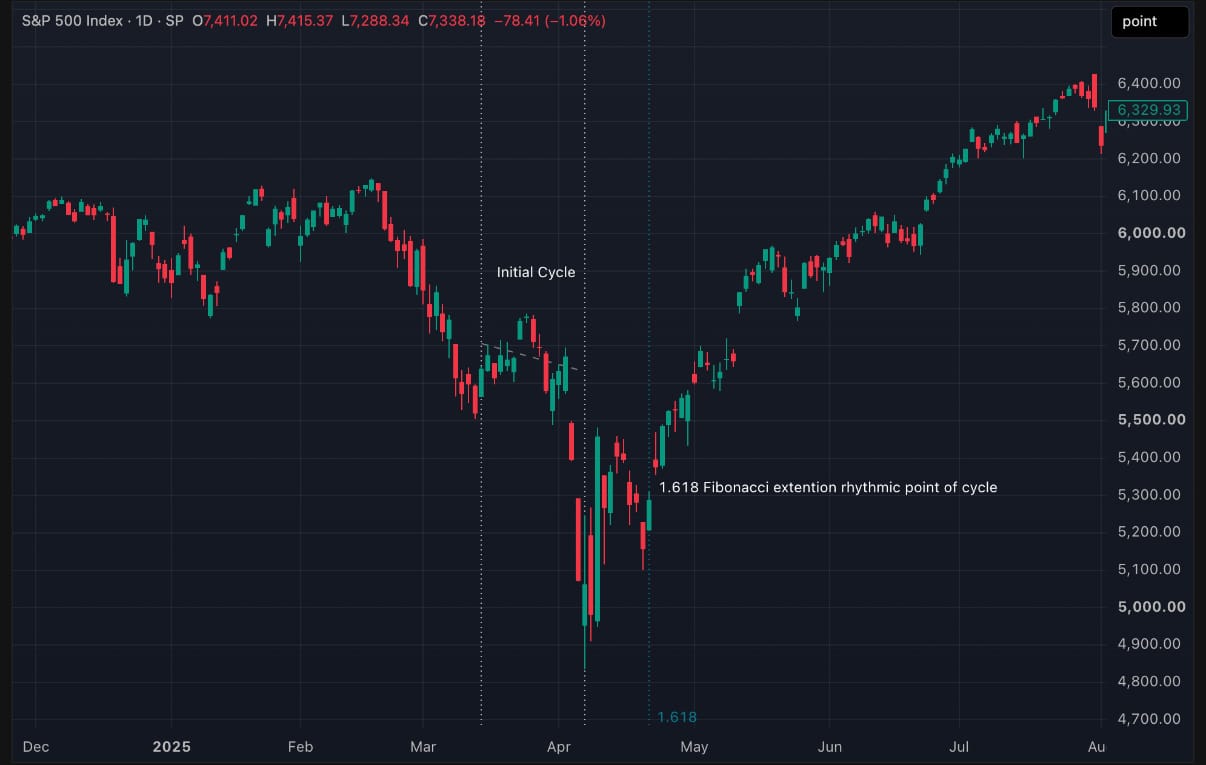
The initial day of the cycle, March 14, coincided with a substantial upside expansion in price before the broader market experienced renewed bearish pressure at the midpoint of the initial cycle.
The conclusion of the cycle on April 7 aligned with the pivotal low of the 2025 tariff-driven market correction.
This low continues to serve as a significant macro structural anchor, providing a reference point for geometric projections, Fibonacci extensions, and historical price symmetry throughout the current market environment.
February 26 – March 20, 2026 | Bearish Structural Transition
Following several months of predominantly compressed price behavior, the initial transition of the February 2026 cycle coincided with a pivotal market high, preceding a substantial period of bearish expansion.
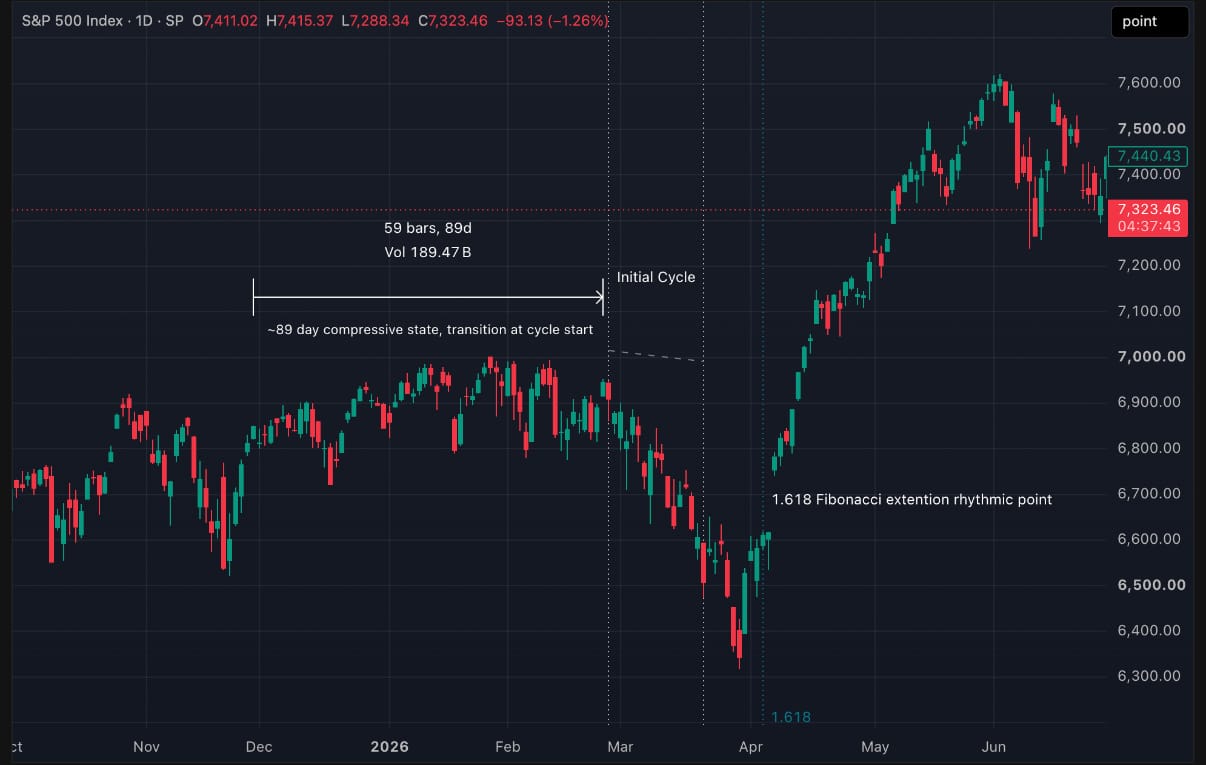
The conclusion of the initial cycle on March 20 aligned with an intermediate pivot low before the market experienced a final phase of downside expansion.
The subsequent transition toward significant bullish expansion developed shortly after April 6 with a large expansion gap, corresponding to the identified 1.618 Fibonacci timing extension of the cycle.
This occurrence demonstrated notable alignment between cyclical timing, Fibonacci time relationships, and the transition between compressed, bearish, and bullish market environments.
June 29 – July 23, 2026 | Compression to Bullish Expansion
The June–July cycle demonstrated heightened volatility while maintaining relatively controlled price behavior throughout the initial cyclical period.
Despite fluctuations in directional momentum, sustained expansion remained limited until the post-cycle phase.
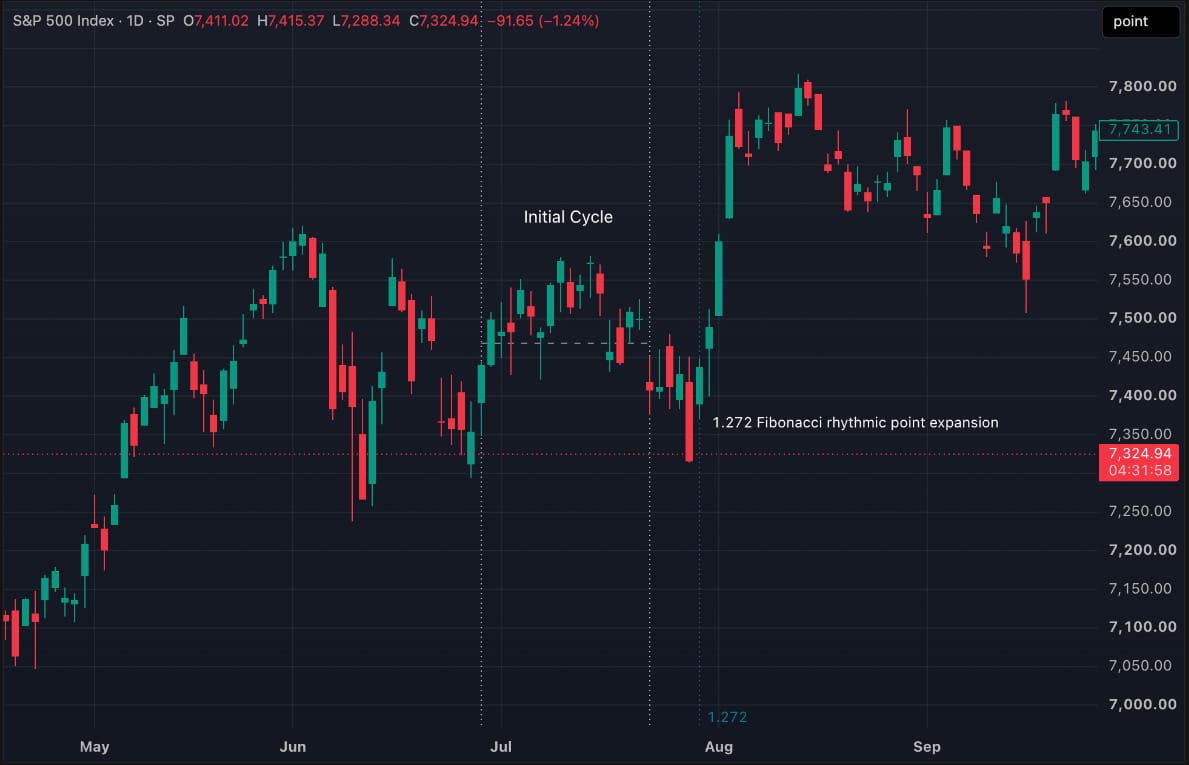
On July 30, corresponding to the identified 1.272 Fibonacci timing extension, the market experienced significant upside expansion.
This occurrence provides another example of the historical relationship between initial-cycle compression and subsequent directional expansion, while also demonstrating the relevance of proportional Fibonacci time relationships beyond the conclusion of the initial cycle.
Current Cycle | October 24 – November 13, 2026
The most recent Mercury retrograde cycle has demonstrated several significant timing relationships within the developing macro market environment.
The initial cyclical transition on October 24 aligned closely with a pivotal market low established on Friday, October 23, the final trading session preceding the beginning of the cycle.
Throughout the initial cycle, increased volatility and bearish pressure became increasingly apparent across the major equity indices.
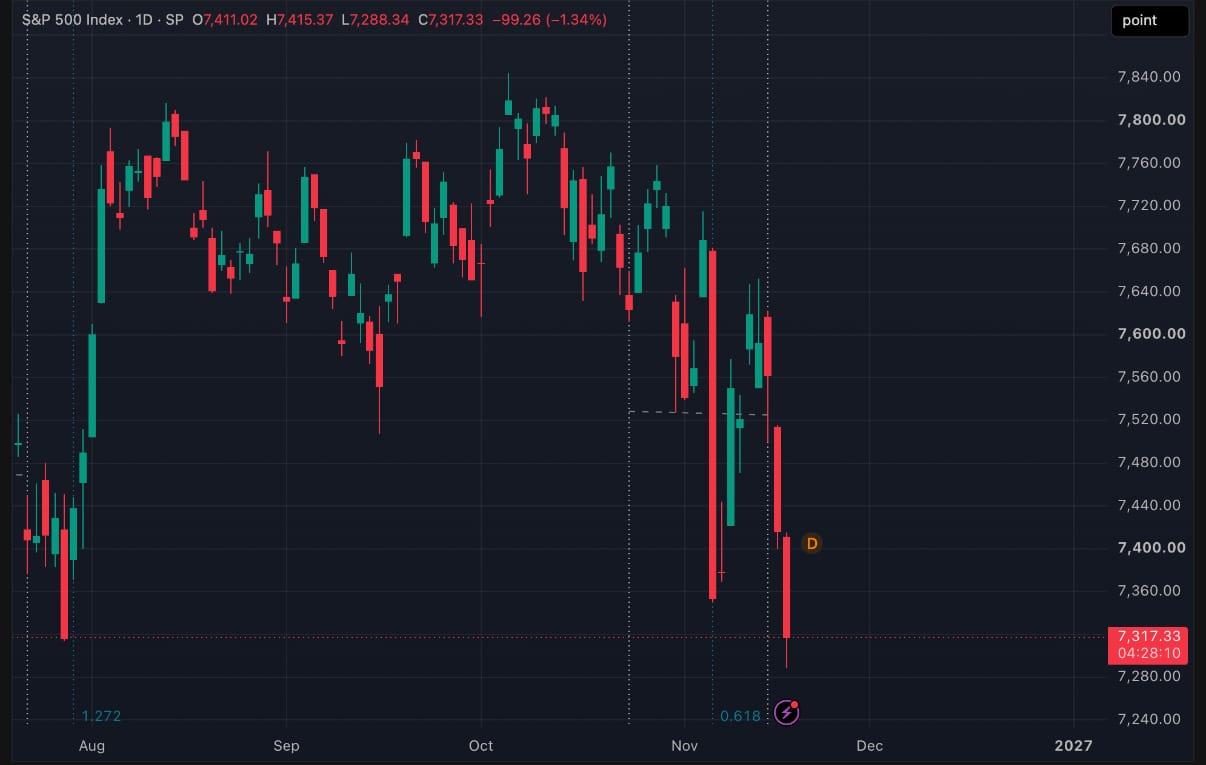
Of particular significance, the identified 0.618 Fibonacci time relationship coincided with a substantial downside movement in SPX of approximately 5%.
Despite the magnitude of this bearish movement, price subsequently retraced into its prevailing geometric structure, preventing confirmation of sustained directional expansion.
The conclusion of the initial cycle on November 13 aligned with another pivotal market high, introducing an important structural reference as the market transitions into the post-cycle environment.
With the initial cyclical period now complete, the projected Fibonacci time extensions will continue to serve as important reference points for monitoring potential volatility expansion, structural pivots, and the establishment of sustained directional momentum.
The significance of the current cycle is further reinforced by its convergence with the broader macro geometric, historical symmetry, and long-duration timing relationships identified throughout this report.
Cyclical Consistency & Macro Market Implications
Through approximately 26 years of historical research, the Mercury retrograde cycle has demonstrated recurring associations with changes in volatility, directional momentum, and broader market behavior.
All three completed initial-cycle occurrences in 2026 have demonstrated notable alignment with significant market pivots or behavioral transitions within the Symmetry Timing Research framework.
While the current year's observations remain consistent with the broader historical study, they do not independently establish the predictive reliability of the cycle.
The application of Fibonacci time relationships to these recurring astronomical cycles introduces an additional dimension of temporal analysis, allowing potential transition points to be evaluated alongside observable market structure and volatility behavior.
Within the current macro environment, the conclusion of the initial Mercury retrograde cycle converges with several significant structural and cyclical developments:
- Major macro Fibonacci price resistance.
- Recurring historical price and time symmetry.
- Potential deterioration of long-term bullish geometric structures.
- The True North Node's passage through Aquarius.
- A developing bullish expansion structure in VIX.
The convergence of these relationships warrants heightened attention to the potential transition from compressed market behavior into sustained directional expansion.
Although the Mercury cycle does not independently determine the direction of such an expansion, its historical characteristics introduce an important timing consideration as SPX and NDQ approach critical macro structural boundaries.
Moving forward, recurring astronomical rhythms and their proportional timing relationships will continue to serve as an integral component of the Symmetry Timing Research framework, with particular emphasis on their convergence with market structure, volatility, and observable changes in market behavior.
Research methodology note: Historical statistics are derived from preliminary internal research conducted by Symmetry Timing Research between 2000 and 2026. Observations reflect historical classifications of compression, expansion, and cyclical market behavior. These findings are descriptive and do not establish causation, independently validated statistical significance, or guaranteed future market outcomes.
Bearish Scenario & Macro Downside Objectives
Macro Downside Framework
With bearish pressure becoming increasingly apparent across the broader equity market, the convergence of historical price symmetry, cyclical timing, and developing volatility structure introduces the potential for a more substantial macro corrective environment.
Should the prevailing bullish geometric structure experience a confirmed breakdown, attention will shift toward deeper structural support objectives derived from macro Fibonacci retracement relationships and long-term geometric projections.
Rather than establishing a predetermined downside objective, this research identifies several significant support regions where the convergence of price, time, and historical geometry may produce meaningful structural reactions or potential macro turning points.
SPX | Macro Fibonacci Support Objectives
From a macro Fibonacci perspective, several significant support regions have been identified through retracement relationships derived from historical market expansion phases.
| Macro Support Region | SPX Price Objective |
|---|---|
| Primary Support | 6,620–6,800 |
| Secondary Support | 6,130–6,320 |
| Extended Macro Support | 4,970–5,260 |
| Deep Macro Support | 3,280–3,560 |
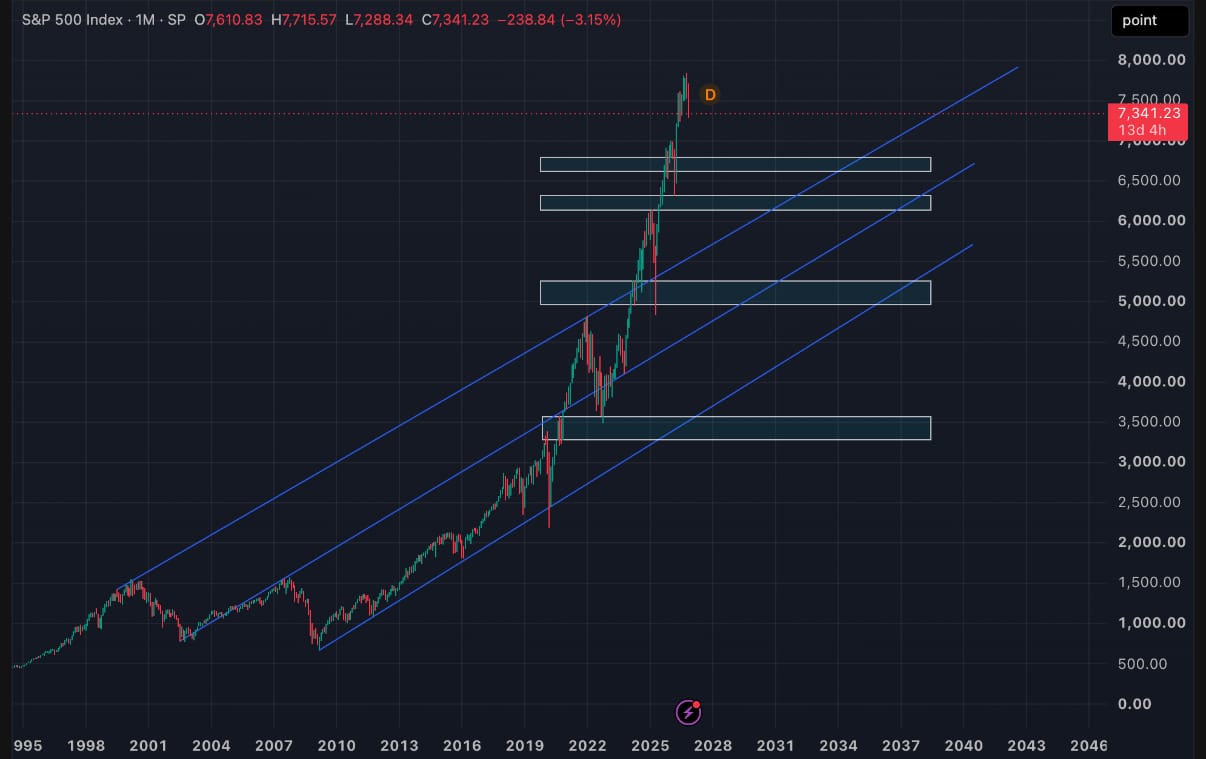
Each of these regions represents an area of potential structural significance should sustained bearish expansion develop.
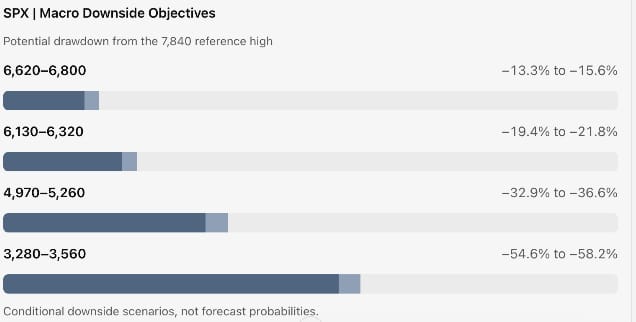
The initial support regions provide important reference points for evaluating the progression of a broader corrective environment, while the deeper macro objectives represent potential scenarios should substantial structural deterioration occur.
The inclusion of deeper downside objectives does not imply that each region is expected to be reached. Rather, these projections establish a comprehensive structural framework for evaluating the potential magnitude of a developing bear market.
The behavior of price and volatility upon interaction with each successive support region will remain essential in determining the probability of further bearish continuation or the emergence of a significant market bottom.
Long-Term Geometric Support | Historical Market Anchors
Beyond macro Fibonacci retracement relationships, long-term geometric projections derived from significant historical market pivots introduce an additional framework for identifying potential structural support.
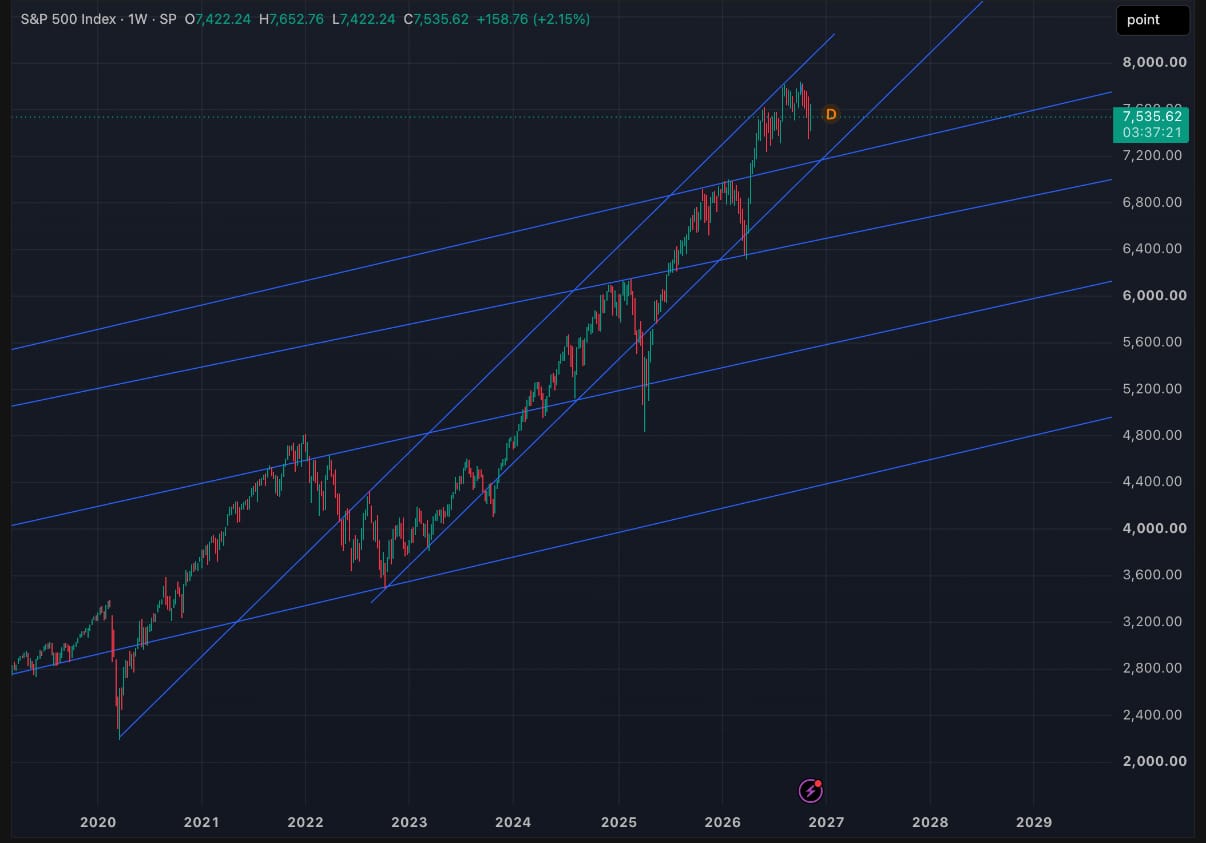
Of particular significance are the geometric relationships originating from three major historical turning points:
- The 2000 market peak.
- The 2007 market peak.
- The 2009 bear market bottom.
These historical anchors establish long-duration geometric trajectories that remain relevant when evaluating the development of the current macro market structure.
Unlike static Fibonacci retracement objectives, geometric support levels evolve over time, introducing an important temporal component to the identification of potential downside objectives.
The convergence of macro Fibonacci support with long-term geometric projections would establish particularly significant regions of price-time confluence, warranting heightened attention for the potential formation of a major market bottom.
The significance of these intersections would be further reinforced should they coincide with historical timing relationships, cyclical transitions, and observable changes in volatility behavior.
Bearish Scenario | Structural Development
The development of a prolonged bearish market environment remains dependent upon confirmation through subsequent price and volatility behavior.
A decisive breakdown of long-term bullish geometric support across SPX and NDQ, accompanied by sustained VIX expansion above the previously identified 21.50–23.80 resistance region, would materially strengthen the broader bearish thesis.
Under such conditions, attention would progressively shift toward the identified macro support objectives, with each successive structural interaction providing additional insight into the magnitude and sustainability of the bearish trend.
The primary objective is not simply to identify the potential extent of a macro market decline, but to evaluate where and when the prevailing bearish structure may begin transitioning toward exhaustion and eventual bullish expansion.
Ongoing Structural Assessment
The downside objectives outlined in this report establish a forward-looking macro structural framework rather than a fixed projection of future market performance.
As market conditions evolve, ongoing research conducted by Symmetry Timing Research will continue to evaluate the confirmation, invalidation, and relevance of these structural objectives through the convergence of:
- Macro Fibonacci price relationships.
- Long-term market geometry.
- Historical price and time symmetry.
- Planetary and astronomical timing relationships.
- Volatility structure and directional behavior.
Particular attention will be given to periods in which multiple analytical relationships converge, as these regions may provide important insight into the development of significant macro market transitions.
The objective remains to identify potential areas of structural significance in advance, while allowing subsequent market behavior to confirm or invalidate the developing research outlook.
Alternative Scenarios & Macro Thesis Invalidation
Bullish Continuation Scenario
Although the convergence of macro geometric resistance, historical price symmetry, Fibonacci relationships, and cyclical timing supports a heightened-risk market environment, the potential for continued bullish expansion remains an important alternative scenario.
The long-term bullish geometric structure that has guided the broader equity market throughout recent years remains a critical benchmark for evaluating the validity of the developing bearish thesis.
Should SPX maintain its prevailing bullish geometric structure and establish sustained upside expansion, a decisive breakout above the previous all-time high near 7,840 would significantly weaken the immediate interpretation of macro structural exhaustion.
Under such conditions, the primary research focus would shift toward a continuation of the broader bullish trend, with a potential retest of long-term geometric resistance becoming increasingly relevant.
The magnitude and sustainability of such an expansion would remain dependent upon the strength of directional momentum, volatility behavior, and the underlying cyclical timing relationships.
Historical Price Symmetry | Alternative Upside Expansion
An additional structural reference for evaluating a potential bullish continuation scenario originates from the March 30–June 2, 2026 bullish expansion swing.
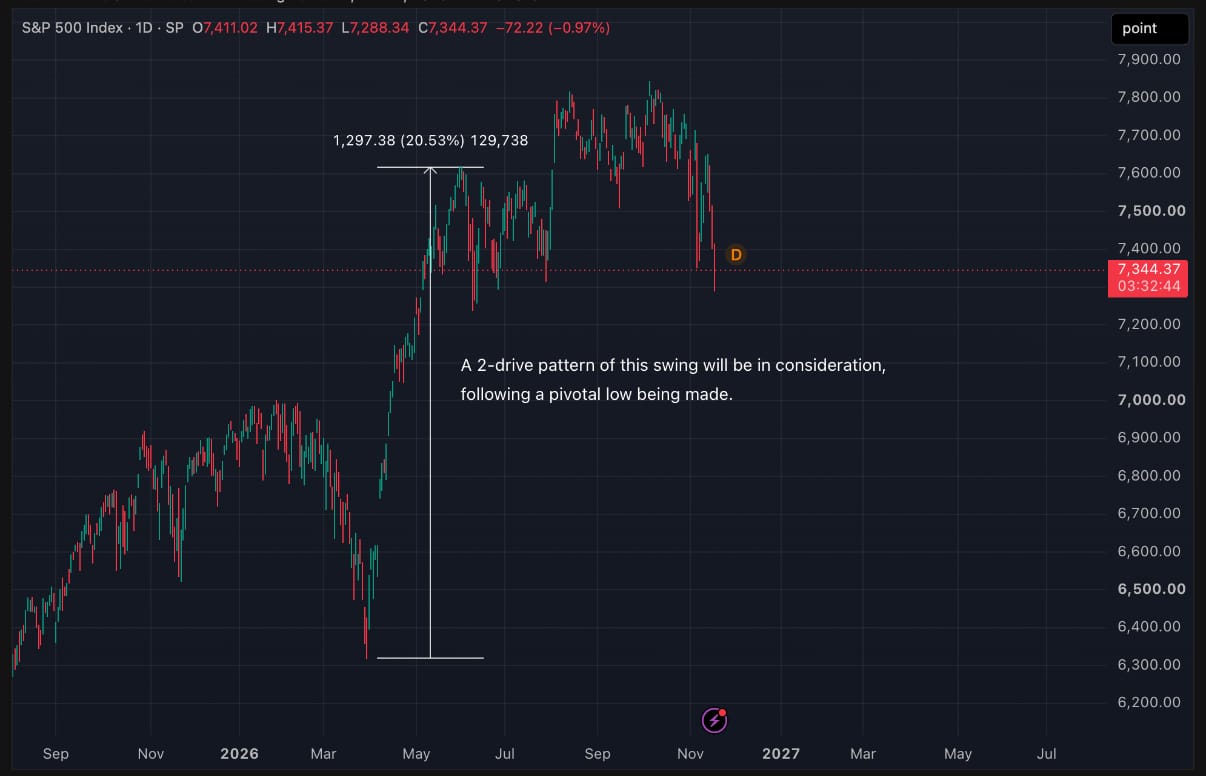
Should the market establish renewed upside momentum and decisively overcome the existing macro resistance region, projecting a symmetrical price displacement derived from this previous bullish expansion would introduce a potential upside objective.
The convergence of this symmetrical projection with long-term geometric resistance would establish an important structural region for evaluating the maturity and sustainability of any renewed bullish expansion.
As with the previously identified bearish objectives, these upside projections remain conditional upon confirmation through subsequent market behavior.
Macro Timing Considerations | Extended Cyclical Risk
An important consideration within the alternative bullish scenario is the duration of the prevailing macro timing framework.
Although several significant price and time relationships have converged near the current market peak, the True North Node's passage through Aquarius is not projected to conclude until March 26, 2028.
As demonstrated throughout the historical study, the formation of significant market peaks has varied considerably in relation to the progression of this cycle.
Consequently, renewed bullish expansion within the current market environment would not necessarily invalidate the broader historical timing relationship. Instead, it would warrant a reassessment of where the market currently resides within the potential macro transition.
The possibility remains that additional bullish expansion could develop before a more substantial corrective environment emerges later within the cyclical period.
However, the existence of this extended timing framework should not override observable bullish market structure or serve as justification for maintaining an unsupported bearish directional bias.
Structural Confirmation & Invalidation
The validity of the immediate macro bearish thesis will remain dependent upon the development of price structure, volatility, and directional momentum.
The primary conditions that would weaken or invalidate the prevailing bearish interpretation include:
- Continued preservation of long-term bullish geometric support.
- A decisive breakout and sustained acceptance above the previous SPX all-time high near 7,840.
- Renewed bullish directional expansion consistent with historical upside symmetry.
- Structural deterioration in the developing VIX higher-low trend.
- A sustained return toward compressed volatility conditions.
Should these developments materialize, the broader research outlook would be adjusted to reflect the renewed bullish structural environment, with attention shifting toward projected upside objectives and subsequent price-time convergence.
The distinction between a historically observed macro risk period and a confirmed bearish market environment remains fundamental to the research framework.
While the current convergence of structural and cyclical relationships warrants heightened caution, the objective of Symmetry Timing Research is not to maintain a predetermined directional bias, but to continually evaluate the prevailing market environment through the confirmation or invalidation of identified analytical relationships.
Subsequent market behavior will ultimately determine whether the current environment represents the early stages of a prolonged bear market or an intermediate corrective phase within a continuation of the broader bullish trend.
Research Conclusion
The convergence of macro market geometry, Fibonacci price relationships, historical price and time symmetry, planetary cycles, and developing volatility structure suggests that SPX and NDQ may be approaching a significant transition in their long-term market environment.
While no individual analytical relationship establishes a predetermined market outcome, the concentration of these relationships near the recent macro market peak, accompanied by increasing bearish pressure and a change in volatility character, warrants heightened caution regarding the sustainability of the broader bullish trend.
The primary focus moving forward remains the confirmation or invalidation of the developing bearish thesis through observable price structure, directional expansion, and volatility behavior.
The objective of Symmetry Timing Research is not to predict market outcomes with certainty, but to identify significant areas of price-time convergence in advance, allowing subsequent market behavior to confirm the nature of the developing structural transition.
Ongoing research will continue to evaluate these relationships as the broader macro cycle unfolds.
Symmetry Timing Research
Independent Time-Based Market Risk Research
Disclaimer: This publication presents independent market research for informational purposes only. Historical relationships, cyclical observations, and projected price objectives do not guarantee future market performance or constitute personalized investment recommendations.
Disclaimer: The information contained in this report is for informational and educational purposes only and should not be construed as investment advice or a recommendation to buy or sell any financial instrument. Past observations do not guarantee future results. All investment decisions are the sole responsibility of the reader.